
QGISRed v0.16
Free professional software to build and analyse Advanced Water Distribution Network Models and Digital Twins
Description
Characteristics
Images
Download
Description
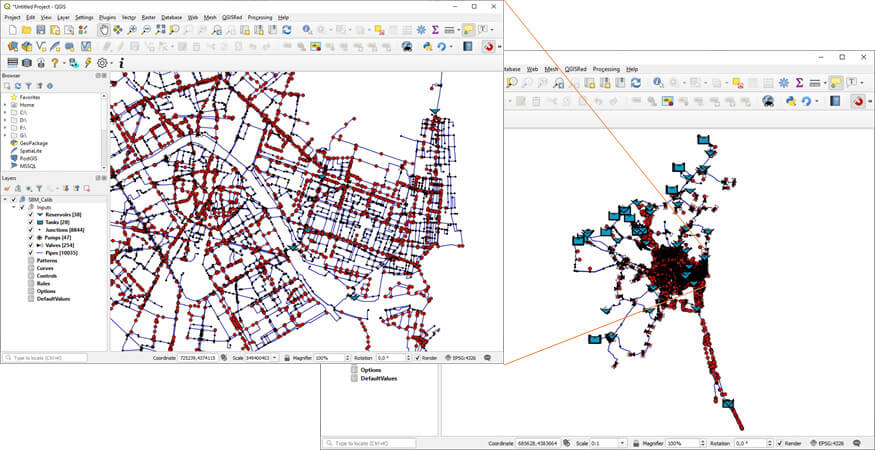
QGISRed is a freeware QGIS plugin developed to assist in building and analysing hydraulic models of water distribution networks of any complexity, up to the level of detail required by Digital Twins. The plugin works seamlessly with QGIS which enables the user to georeference all network elements, use geographic background layers, edit graphical and alphanumeric data, use geoprocessing tools, visualize data by layers, customize the symbology, etc.
QGISRed relies on an easy-to-use relational database of SHP and DBF files based on the EPANET data model, which has been extended to add new capabilities. Starting from the EPANET data model significantly reduce the learning curve.
In fact, the previous skills required on QGIS are minimum because QGISRed provides numerous tools to help building hydraulic models, to manage demand scenarios and to analyse the results without the need to use the QGIS environment.
Nevertheless, in case the user decides to use the QGIS tools to edit the data, QGISRed provides powerful facilities to detect potential editing errors before simulating the model, or to fill in the missing information.
The QGISRed extension for QGIS is an update of the old GISRed application developed by our group for the ArcView 3.1 environment (see launching paper). Currently the name GISRed has been kept concerning to the libraries developed in .net, which are used by QGISRed to improve the processing time and constitutes the core of the GISRed standalone application.
The development of the new QGISRed plugin is an initiative of the REDHISP Research Group of the Institute of Water and Environmental Engineering (IIAMA) of the Universitat Politècnica de València, UPV (Spain), led by Professor Fernando Martínez Alzamora. Its implementation is carried out by the WaterPi company under the direction of Néstor Lerma, PhD Eng.
For more information the user can check the official website of QGISRed or the section of QGISRed in the official QGIS plugin repository. Also a User’s Manual in English is available.
Requirements: QGIS 3.2.0 or higher, Net Framework 4.5 – Windows OS.
Characteristics
Among the numerous options offered by QGISRed to facilitate the construction of Hydraulic Models of Water Distribution Networks and Digital Twins, the following stand out:
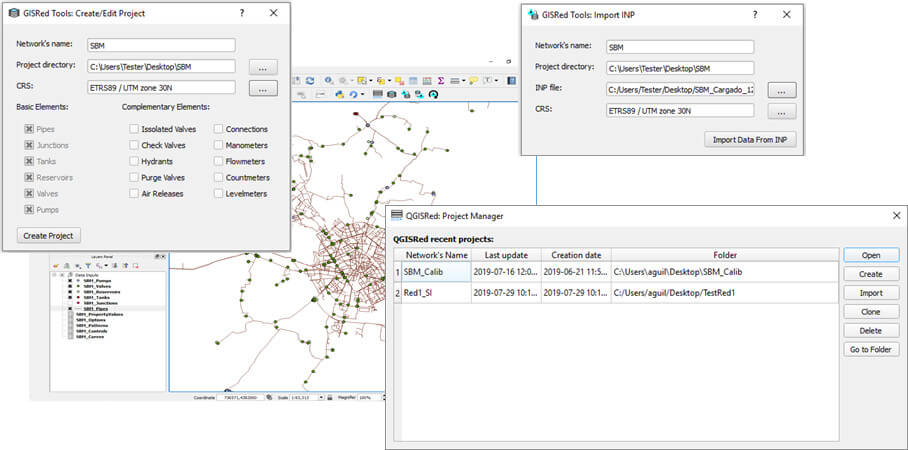
- Project manager for easy project loading and storage
- Automatic creation of new empty projects
- Creation of a project backup
- Import/export EPANET INP files
- Import basic network components from Shapefiles and other auxiliary components managed by the Digital Twin (DT) such as service connections, isolation valves and meters. Shortly also hydrants, purge valves, etc.
- Automatic generation of topological relationships between all the network elements
- Graphical editing tools for all network elements including those of the DT (add, delete, move, edit vertices and nodes, reverse links, multiple selection, etc.)
- Tools to debug the network layout and verify its connectivity
- Default values to newly created elements
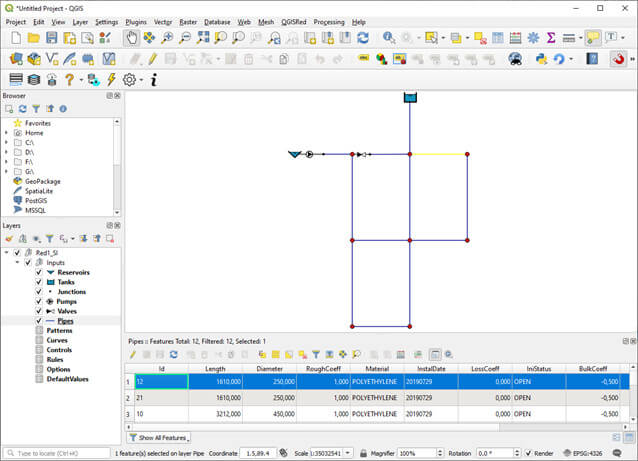
- Property editor for all model and DT component attributes, including a browser.
- Complete editor of analysis options and default values
- Automatic calculation of pipe lengths from the coordinates of the vertices
- Automatic interpolation of node elevations from DTM
- Automatic estimation of pipe roughness from material and age of pipes
- Conversion of roughness coefficients between different headloss formulas and unit systems
- Visualization of multiple demands and quality sources as distinct layers and edition of its properties integrated with those of nodes
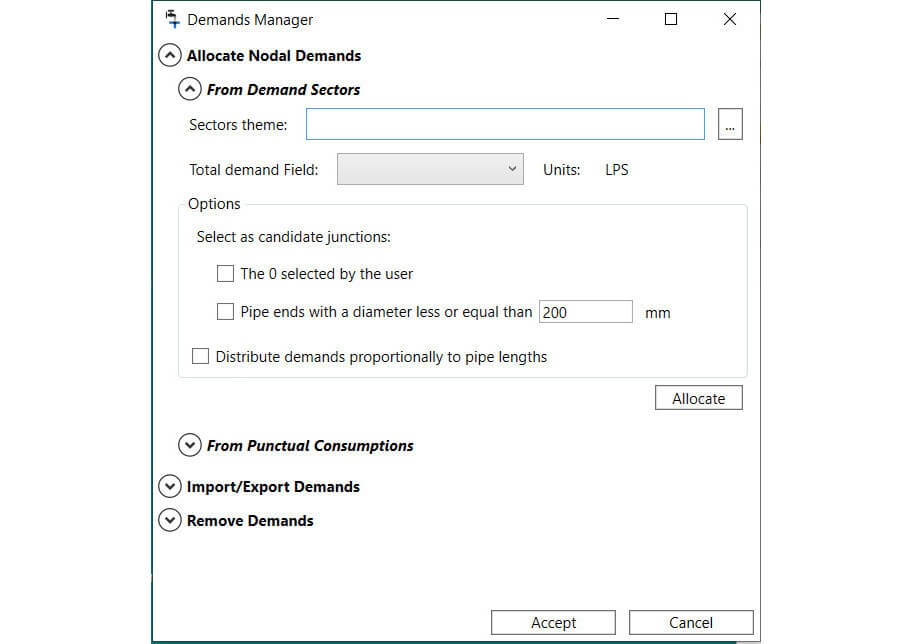
- Automatic nodal demand allocation from punctual or sectorial consumptions
- The managing of scenarios with multiple demands by category
- Automatic pattern and hydraulic efficiency allocation by sector
- Scenario management for various model parameters by importing/exporting files
- Powerful editors of curves, patterns, controls and rules
- Validation anywhere of model properties against typical data entry errors
- Management of service connections and isolation valves as differentiated elements
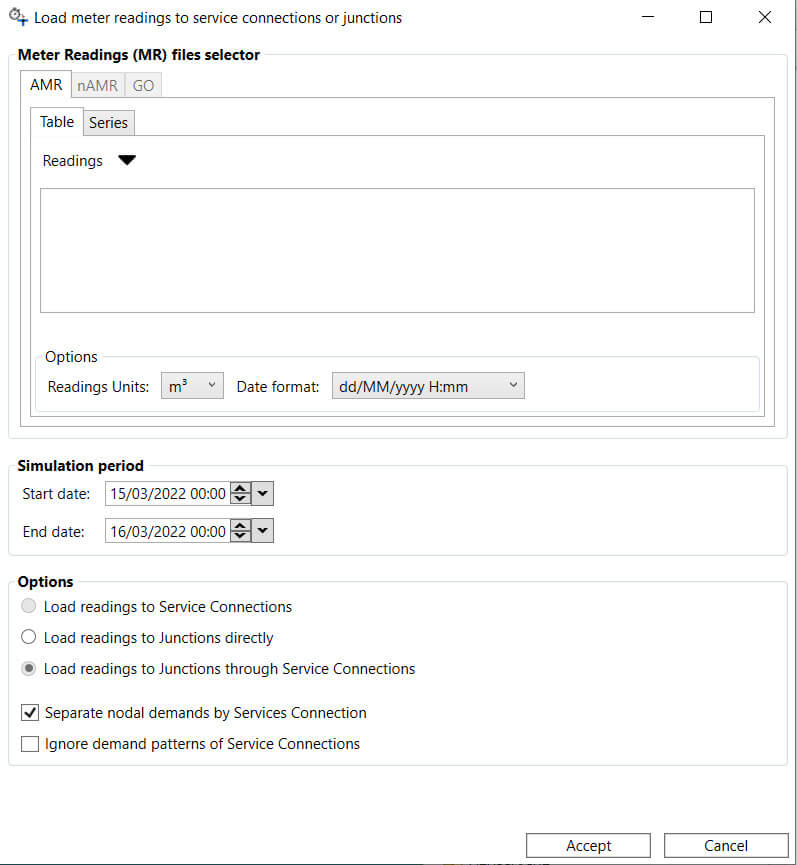
- Load of demands to service connections from the meter readings, and move them to the closest nodes
- Detection of isolated zones when closing the isolation valves and canceling the demands on them
- Optional integration of service connections into the model
- Declaration of the meter sensors as distinct elements and the association of signals to them
- Reading field data for the simulation period from files and export to EPANET
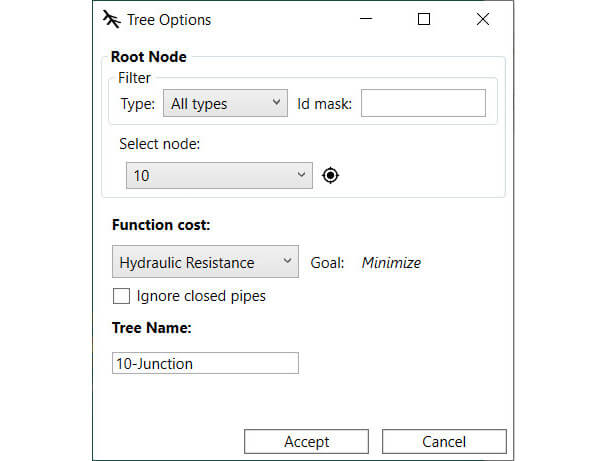
- Automatic identification of hydraulic sectors and demand zones
- Model simulation by using the EPANET toolkit 2.2
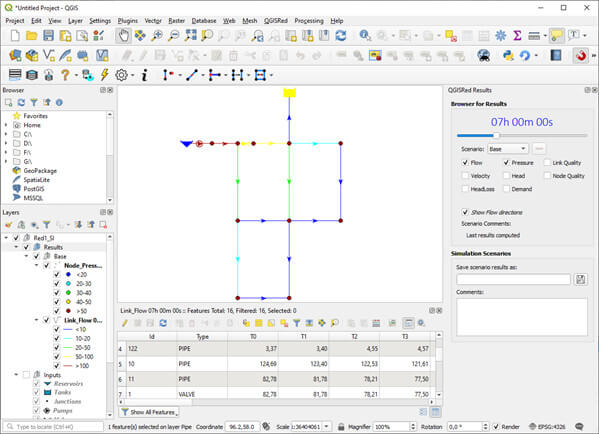
- Visualization of simulation results by means of tables, color coded layers, arrows and floating or static labels
- Automatic creation of legends and symbols for the results (customizable with QGIS tools)
- Timeline bar to display simulation results
Change log:
The last version 0.16 has added the following features:
- New options in the nodal demand manager to declare consumption for the entire network or by zones.
- Option to export, edit and re-import links between point consumption and junctions
- New options for importing/exporting/deleting demand scenarios by categories
- New tools in the nodal demand manager to consider water efficiency or assign consumption patterns by sectors
- New scenario manager to store and retrieve some model parameters in block
- Automatic calculation of pipe lengths from the coordinates of the vertices
- Automatic service connection layout, creating a perpendicular to the nearest pipe or a link to the nearest junction
- Possibility to automatically trace connections of predefined length from a point on a pipe or a junction
- New option to mirror a service connection with the invert tool
- New option to import service connections as points, creating perpendiculars to the nearest pipe or junctions
- New IsActive field in service connections to define if it is operational or not
- Verification of the contact point of a service connection with a pipe or junction at both ends
- Before calculating the hydraulic sectorization, the status of the manual valves is now transmitted to the pipes
- When exporting to INP the loss coefficient of the shut-off valves is transmitted to the pipes
- Declaration, editing and deletion of meters of various types, as new elements of the Digital Twin
- Editing, reading, and saving of signals associated with meters
- New dialog for reading field data and exporting to CSV those corresponding to the simulation interval
- New option to export the field data, together with the INP file
- New fields in the import dialog, to be able to import more element information
- New option to show in the auxiliary themes the elements with some incidence, during the shapefile importing process
- New buttons and new slider in the results panel
- Improvements in the labels to display the results
- New type of result to display the Status of lines
- Improvements in the search from the property editor
- When exporting INP, a new list of EPANET executable paths is offered to automatically open the exported file
- When importing an INPs file, patterns are now classified by type
- New warning has added when autocompleting the ID of an element
- Changes in the order and names of some toolbar buttons
- Changes in the visual styles of some of the elements
- New link to QGISRed website in the info window
- Fixed an error when reading the IDcurve in GPV valves and editing it from the properties dialog
- Fixed an error when assigning default values to bulk and wall reaction coefficients while importing an INP file
- Fixed a bug and message displayed when reading quality sources in reservoirs and tanks
- Fixed a problem that caused the point selection tools to stop for certain features
- Fixed a bug in the tool to create T-connections massively
- Fixed a bug with the multiple selection tool
- Fixed a bug in the polygon selection tool, when the reference system was not assumed by default
- Fixed a bug with the snapping tool (point selection of elements) in QGis version 3.26
Images
Download
| Description of the file |
|---|
| QGISRed (QGis Official Repository) |
| QGISRed v0.16 User’s Manual (PDF) (2 Mb) |
Installation
The above link to the QGIS repository is documentary only. The QGISRed plugin is installed from the QGIS Plugins menu, Manage and install plugins… From tab All of the new window search for QGISRed, and finally press the Install Plugin button.
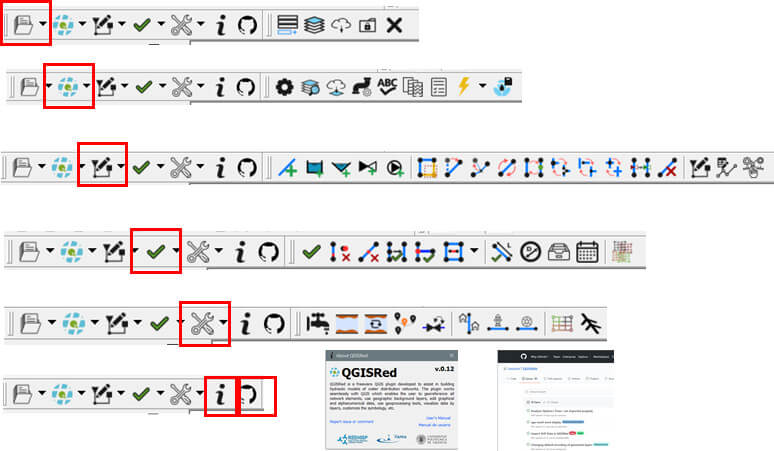
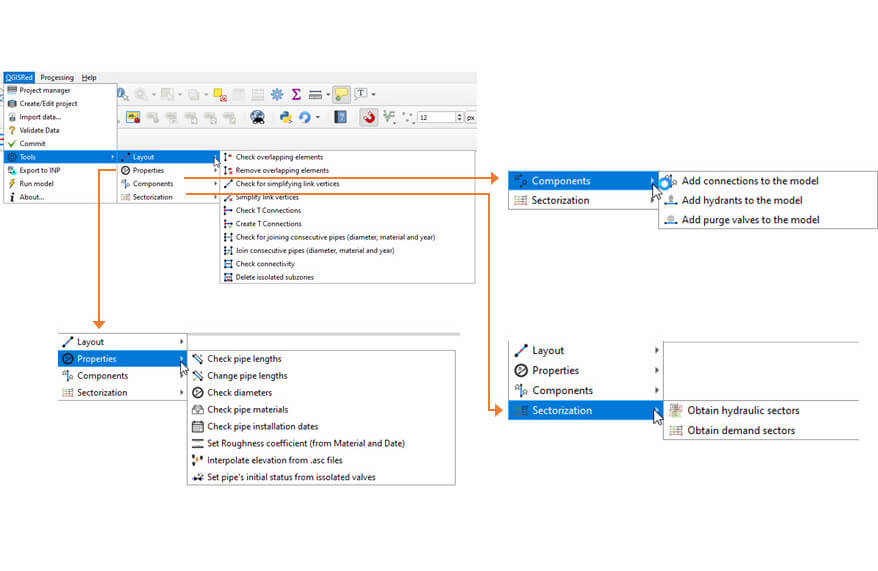
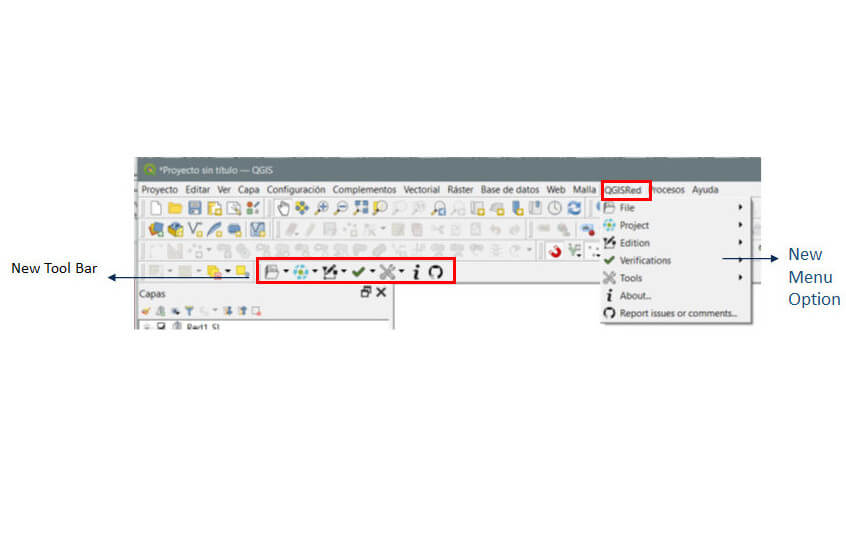
Installation is very fast, and if everything goes right, a new menu option called QGISRed will be displayed in the Main Menu bar, where all the built-in features are accessible. In addition, a new Toolbar called QGISRed will be displayed with drop-down buttons to access all the features as well.
The first time any option of the new plugin is executed, the installation of the GISRed library will be requested, which completes the installation of the QGISRed plugin
When new updates are released, selecting QGISRed from the Installed tab of the Manage and install plugins window will display a notice at the top, and the Update Plugin button at the bottom.